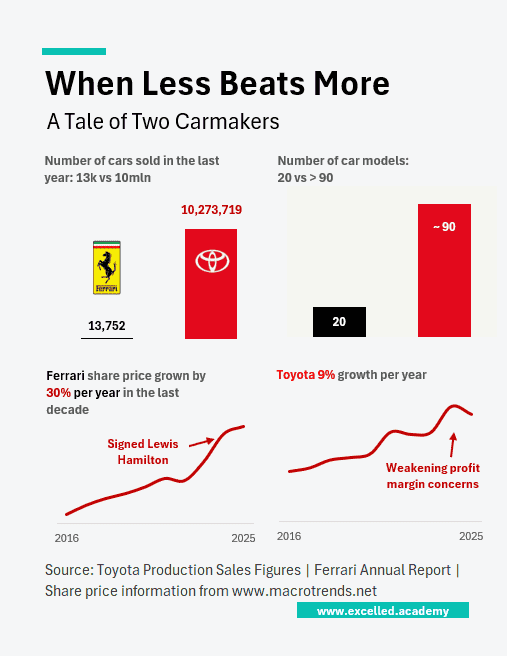
When Less Beats More:
A Tale of Two Carmakers
15 JULY 2025
This chart is powered by Excel. You don't need fancy tools. Just Excel
We often assume that more - more data, more details, more numbers - is better. But too much information can overwhelm your audience. Less is always more.
This Week's Chart Drop
Ferrari sell just 13,000 cars a year, while Toyota sells over 10 million.
No surprise, Ferrari builds supercars with eye-watering price tags, while Toyota is the world’s largest carmaker by volume.
But here’s the twist: Ferrari offers only 20 models. Toyota? Over 90.
And yet, over the last decade, Ferrari’s share price grew 30% year-on-year. Toyota’s? Just 9%.
In business, as in design, less can truly be more.
This Week's Design Trick
If you're adding a text box or image to a chart, click the chart first, then insert it. This creates a natural grouping so if you move the graph, all the objects move with it.
Each week, I share one simple Excel visual—from sport, business, or personal finance—to give finance professionals ideas on how to present their data
Subscribe to get the weekly chart to your inbox