
Lululemon: Downward Dog
21 OCTOBER 2025
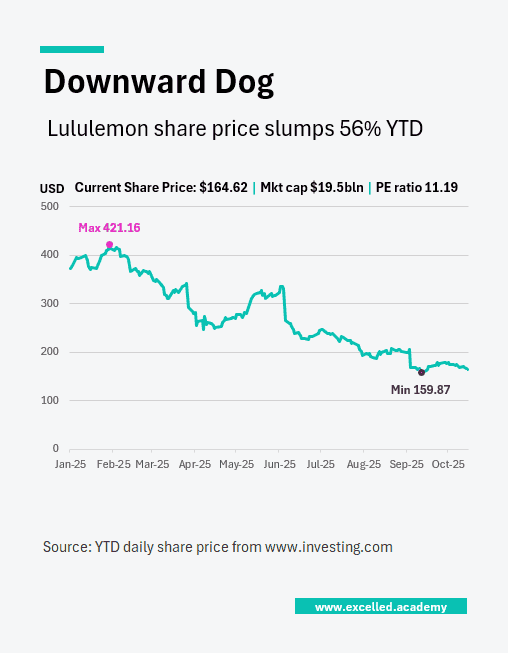
Chart Drop
After years of strong performance, Lululemon’s share price has stalled. The company has acknowledged becoming too predictable, losing ground to younger competitors while delaying major product updates until 2026. What was once a category-defining brand is now navigating the tension between reinvention and relevance.
This Visual is designed for:
- Editorial coverage on consumer brands and retail trends
- Investor commentary and earnings analysis
- Strategy and positioning discussions in presentations
Contact us to licence or commission a visual